
China Perspective Issues
BOOK REVIEWS
Exploring Differences in Trends Between Private and Subsidised Housing Prices in Hong Kong
Eddie Chi Leung Cheung is Assistant Professor in the School of Arts and Social Sciences at Hong Kong Metropolitan University, No. 30 Good Shepherd Street, Ho Man Tin, Kowloon, Hong Kong (clcheung@hkmu.edu.hk).
Yiu Chung Ma is Assistant Professor in the School of Arts and Social Sciences at Hong Kong Metropolitan University, No. 30 Good Shepherd Street, Ho Man Tin, Kowloon, Hong Kong (ycma@hkmu.edu.hk).
Kwok Ho Chan is Assistant Professor in the School of Arts and Social Sciences at Hong Kong Metropolitan University, No. 30 Good Shepherd Street, Ho Man Tin, Kowloon, Hong Kong (kwhchan@hkmu.edu.hk).
Introduction
Since residential property prices recovered from a slump in 2004, the most important housing issue prevalent in Hong Kong is probably that of worsening affordability, with real estate prices rising dramatically until the Covid-19 pandemic. In fact, in different guises, this issue has been on the government’s agenda for much longer than that. Like many other places in the world, Hong Kong has a long history of providing different forms of social housing. Over the decades, amid changes in the economic landscape and a generally improving level of development in Hong Kong society, the scope of social housing has gradually shifted from subsidised rental housing alone to cover assisted homeownership as well.
Subsidised housing started its life in Hong Kong in 1952, when the nongovernment, not-for-profit Hong Kong Housing Society built the first estate for low-income families and charged below-market rent. The government followed suit in 1954 by building public rental housing (PRH), also charging rents far below market rates. The aim of building these early housing estates was primarily to house the masses of slum dwellers and otherwise homeless people; homeownership and its affordability were not part of the concern. Over the ensuing seven decades, the desire for better quality housing has gone hand-in-hand with rapid economic development in Hong Kong. According to data from the World Bank as far back as available, between 1961 and 2022, the real gross domestic product (GDP) per capita in Hong Kong has risen by 11 times, leading to dramatic improvements in living standards and social development. This sustained rise has happened in tandem with a steadily rising population, from 3.16 million in 1961 to a peak of 7.51 million in 2019.
As overall living standards rose, there was increasing aspiration for higher-quality housing and homeownership. It was against this backdrop that the government launched the Home Ownership Scheme (HOS) in 1976, building new housing and selling housing units at heavily subsidised prices to lower- and middle-income households.[1] All government-built social housing enjoys large subsidies. Apart from the heavily subsidised rents for PRH households, new HOS flats are typically sold at discounts of 20% to 50% of prevailing market prices to PRH residents and other eligible buyers.[2] It is therefore no surprise that demand for them from less well-endowed households has always outstripped supply.[3] Over the ensuing decades, many HOS housing estates were built to meet increasing demand, and in 2023 they formed 14.2% of the housing stock in Hong Kong. Together with a further 28.4% of PRH, the proportion of social housing in Hong Kong comes to a total of 43.3% of the entire housing stock,[4] a surprisingly high share given Hong Kong’s reputation as a laissez-faire economy.
As might be expected, subsidising such a large stock of housing imposes an onerous burden on government finances. A lot of public resources in the form of rent, shared-equity subsidies, and land area are used to build and fund social housing. Therefore, another important way of meeting this demand is for current residents in such housing to climb up the housing ladder, eventually moving to the private market so that existing flats can be allocated to other needy households. This process involves incumbent PRH residents buying their first subsidised HOS home and vacating their flats, and HOS homebuyers selling their flats before moving into private housing. However, to do so, PRH residents will need to accumulate a sizable, albeit subsidised, downpayment; and under existing regulations, an HOS household that sells its current flat into the private market and moves into private housing must pay the same percentage of sale proceeds as the original subsidy back to the government. Given the generally rising property prices over the decades, that implies PRH households will need to pay larger downpayments, and HOS households who sell to the private sector will also need to pay a much larger sum back to the government. Such payments create an incentive for these households to stay in their current dwellings and not move on to the next step on the housing ladder, particularly as the quality of both PRH and HOS housing has gradually improved over the decades.[5] This in turn increases the pressure for the government to build more new social housing to satisfy new applicants, creating more pressure on public resources.
Additionally, the prices of HOS flats may also not move in lockstep with those of similarly sized private flats. This is because the sale of HOS flats to private market participants is subject to resale restrictions. Indeed, HOS owners are not allowed to sell their flats into the private sector until several years have passed. Within this period, they can only sell it back to the Housing Authority, at a price lower than the original purchase price. Also, if the sale of an HOS flat is to a buyer who currently resides in a PRH flat, or one whose income and wealth are below HOS thresholds, then the government will not reclaim the subsidy, in effect transferring it to the new owner. These transactions are described as HOS secondary market sales. Figure 1 shows the trend of various classes of property prices in Hong Kong from 2006 to mid-2023, rebased to 100 in 2013. In the figure, the RVD Index (All) and RVD Index (A) are indices reported by the Rating and Valuation Department (RVD) of the government. The RVD Index (A) reports prices of flats of size less than 40 m2, and the RVD Index (All) is for flats of all sizes. The HOS Price index represents the transactions of HOS flats in the secondary market.[6] As the graph shows, all three indices have risen in the measurement horizon, and even if they have been dropping since 2020, their current values are still closer to the higher end of the available data. Furthermore, the trajectories of the HOS secondary flat prices differ from private market flats, particularly since around 2013, when the HOS price series started rising faster, until 2020 when it started to fall faster than private flats.
Figure 1. Movement of different property price indices in Hong Kong 2006-2023 (2013 = 100)
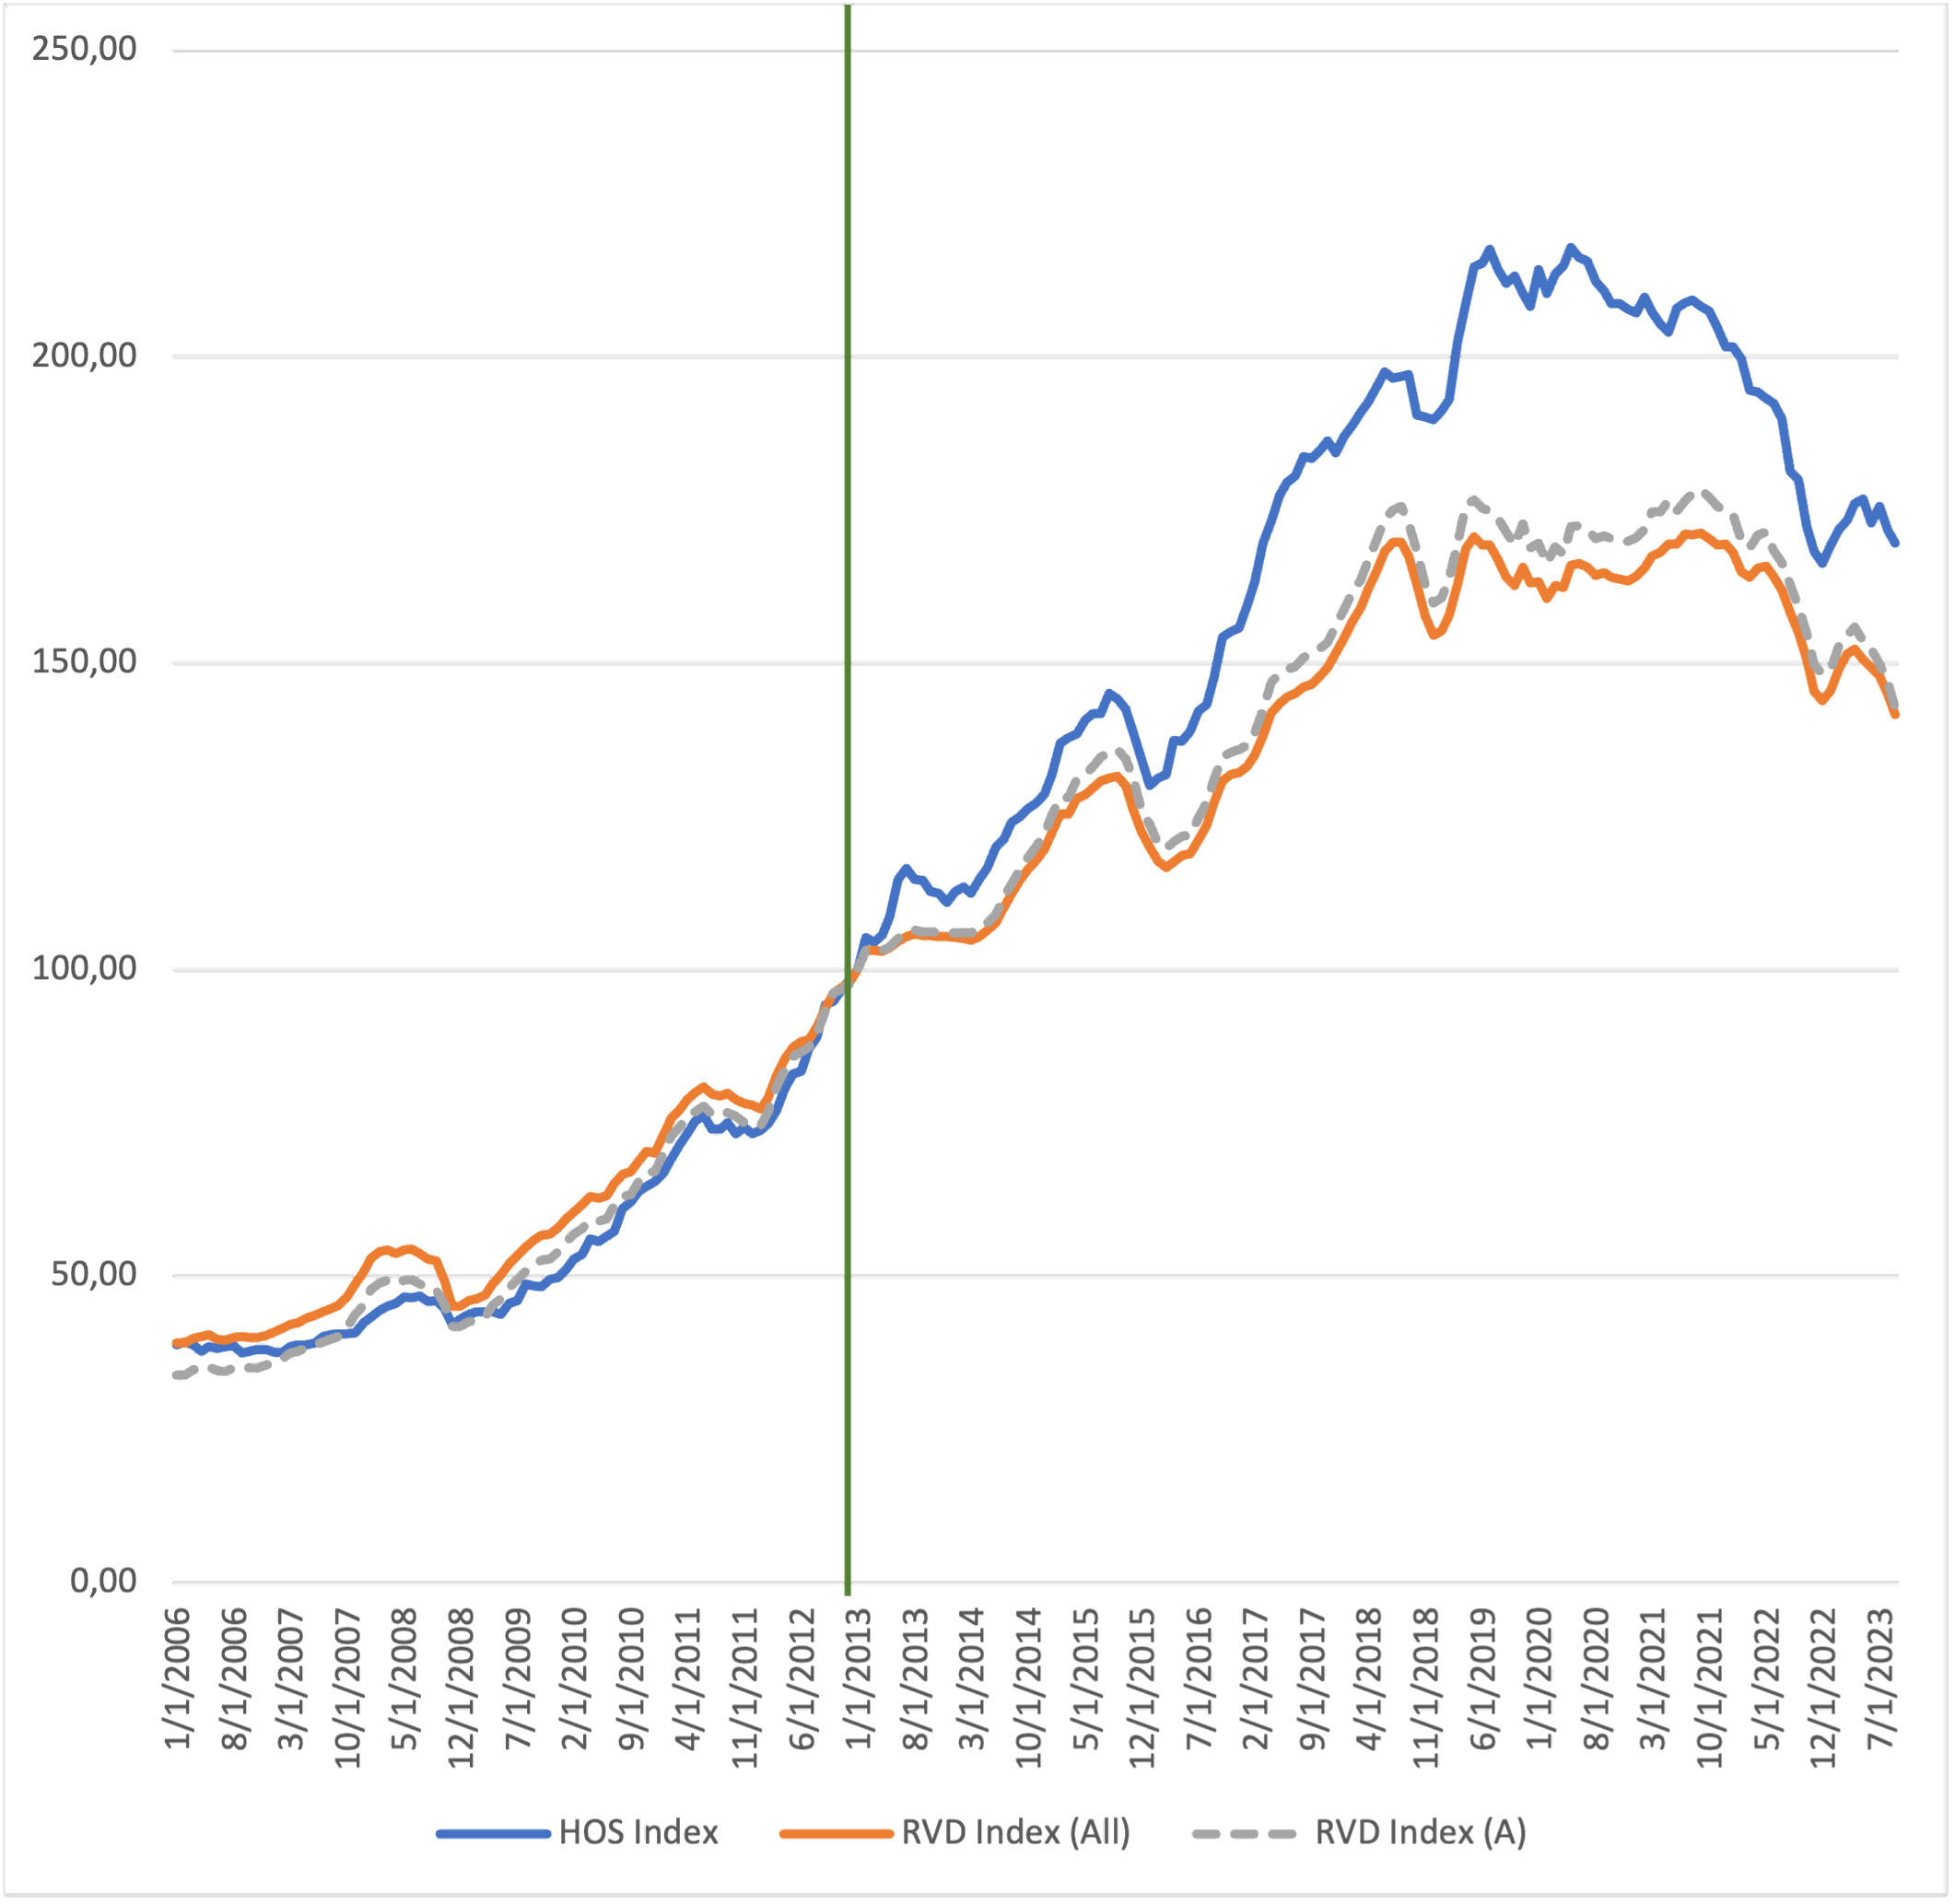
Note: vertical line represents the year when the White Form Secondary Market Scheme was implemented in 2013.
Sources: authors’ calculations based on the figures from Rating and Valuation Department, HKSAR Government.
The objective of this paper is to explore the differences between the prices of HOS flats in the secondary market and other private properties of similar size by looking into their determinants, and to examine whether specific policies directed at the HOS secondary market, such as the White Form Secondary Market (WSM) Scheme,[7] may have an impact on HOS prices and the volume of transactions. To preview our findings, the results from our empirical analysis on the determinants of the prices of private and subsidised housing show that the prices of publicly subsidised housing cannot be explained by standard market variables. Similarly, the implementation of the WSM Scheme also has no significant effect on HOS prices but has a large and positive effect on transaction volumes. We also examine the volatility of the two types of housing prices and surprisingly find higher volatility in subsidised housing prices than in private ones. This divergence is particularly strong after the implementation of the WSM Scheme.
The next section reviews the literature on social housing and its historical development. Then, more institutional detail of HOS housing policy is examined, and we look at how HOS housing fits into the housing ladder in Hong Kong. We also attempt to identify some specific factors that may affect HOS prices in the secondary market. The discussion then moves on to describe the empirical analysis and present the results. Concluding remarks are given in the last section.
Literature review
Early studies of social housing around the world have generally looked at its development since the twentieth century through the lens of the welfare state, with government-provided housing being one aspect of policies to promote the general public’s well-being. As a result, descriptions of housing systems across different countries have commonly been classified into housing regimes, based largely on the work of Esping-Andersen (1990) and Kemeny and Lowe (1998). Regarding social housing as part of the welfare state, the focus of such studies is on how well publicly provided rental housing has fulfilled the stated aims of the welfare state policies in place (Ball 2020).
However, the cross-country empirical study of Kholodilin, Kohl, and Müller (2022) documents that as a housing category, social rental housing arose in the 1920s, reached its peak in the 1980s, and has been in decline ever since. In its place the homeownership rate, oftentimes publicly assisted, has risen uninterruptedly since the 1930s and only stopped doing so in the 2010s. Not surprisingly, the attention of more recent studies has thus shifted to include mortgage finance, homeownership, and the influence of government policies on such parameters (Schwartz and Seabrooke 2008).
Most housing studies are on advanced industrialised countries, usually northern European, as they tend to have better historical data. Consequently, the typical story about social housing that emerges is also a northern European one – large-scale social rental housing arose in the postwar period as part of the welfare state, which in subsequent decades led to social problems such as pockets of relative poverty in the housing developments. A new wave of market-oriented policies then focussed on helping households to purchase their own homes, leading to a reduction in social rental rates and growing homeownership (Allen 2006; Kohl 2017). But as Allen (2006) and Ball (2006) note, this need not be applicable to other parts of the world, since the institutional background and thus the structure of provision of housing in every country or region is different.
On the more general issue of demand for living space by families, Banks et al. (2017) suggest that there is a natural progression in demanding larger and better-quality, i.e., more expensive, housing over the first half of the life cycle. The reason is that many young individuals who leave home will form families and have children. By studying these households in the United States and Britain, the authors find evidence that higher volatility in property prices will provide an incentive for earlier homeownership. Since housing prices have generally been trending upwards over the decades, owning homes earlier against a background of high housing price volatility gives households a hedge against the chance that the kinds of housing they will want later in life will become very expensive. Based on similar reasoning, Sinai and Souleles (2005) document with US data that the probability of homeownership rises also when volatility in rents is higher.
HOS, the housing ladder, and HOS housing prices in the secondary market in Hong Kong
In comparison to the experience of other advanced economies, social housing in Hong Kong provides an interesting case study because the trajectory of Hong Kong’s economic development since the mid-twentieth century is quite different from other developed countries. While its experience of postwar social rental housing development is similar to them, Hong Kong is also an outlier as the growth in both PRH and assisted homeownership have been enormous throughout. Assisted homeownership is somewhat detached from market-based residential construction, with mostly government-built HOS developments forming the vast majority of assisted homeownership flats. In particular, in the name of macroeconomic management, it is the assisted homeownership schemes that were stopped in 2002 instead of reduction in PRH,[8] against the international trend at the time. HOS would not return until 2014, when housing affordability problems had become much more acute.
The postwar development of Hong Kong society also differs greatly from the European experience (Caudevilla 2017). Industrialisation took place after World War II when incomes rose rapidly, raising the demand for housing. At the same time, unlike southern European countries (Allen et al. 2004), family networks as a source of housing provision were also lacking in Hong Kong, due mostly to the large and consistent influx of refugees and immigrants fleeing unrest in Mainland China (Jones 2003). Together with the small geographical area of Hong Kong, supplying adequate housing has always been an acute problem (Pryor 1972).[9] Under such circumstances, it would make sense for the government to take on the job of building social housing to increase overall supply quickly instead of relying on market-based policies to help families find housing in the private market.
Even in the early study of Hong Kong social housing by Pryor (1972), it is apparent that the objective of government-built housing at that time was to provide accommodation for those with very low income, and with the rapid rise of incomes as economic development took hold, it was only apt that better-off residents would leave public housing, freeing up such flats for the still numerous needy households. Indeed, one of the official aims of building HOS housing in the first place was to help public rental residents graduate to homeownership. Over the ensuing decades, the economic incentives behind the trends, desires, and difficulties of moving to other better housing or leaving the family home have become an important direction of research for most studies of public housing in Hong Kong - see for example Yeh (1990), Lui and Suen (2011), Li J. (2014, 2016), Forrest and Yip (2015), and Cheung and Wong (2020).[10]
For a typical lower-income household in Hong Kong, the trajectory of its housing journey may start with renting a small, perhaps shared, private dwelling, then applying to rent a PRH flat, later on making a first purchase of a subsidised HOS flat if means permit,[11] and finally accumulating enough resources to buy a home in the private market. Only if incomes are very high, or if family endowment allows, will a household directly buy a first home in the private market.
In Hong Kong, the above path has become more difficult in recent years. Since a prolonged slump in property prices ended in 2004, residential housing prices have risen dramatically all the way until 2020. A representation of this rise can be seen in Table 1, which tracks the ratio of the average price of a small flat in the private market to median annual income from 1991 to 2022. While the ratio dropped after 1991, once it came back in 2011 the number has kept on increasing.[12] Putting the information from Figure 1 and Table 1 together shows that property prices have generally become less affordable in the past three decades, and that HOS prices have gone through more wild swings since 2006.
Table 1. Comparison between property prices and labour income in Hong Kong (1991-2022)
| Year | Average price of a property of 300 square feet (27.87 m2) in the New Territories (HKD) | Median income from main employment of working population (HKD) | Ratio of property price to annual median income (years) |
| 1991 | 784,920 | 5,170 | 12.65 |
| 1996 | 1,172,812 | 9,500 | 10.29 |
| 2001 | 783,964 | 10,000 | 5.78 |
| 2006 | 845,398 | 10,000 | 7.04 |
| 2011 | 1,633,355 | 11,300 | 12.05 |
| 2016 | 2,886,973 | 15,000 | 16.04 |
| 2017 | 3,419,859 | 15,500 | 18.39 |
| 2018 | 3,891,621 | 16,500 | 19.65 |
| 2019 | 4,067,432 | 17,100 | 19.82 |
| 2020 | 4,211,134 | 17,800 | 19.72 |
| 2021 | 4,257,704 | 18,000 | 19.71 |
| 2022 | 3,999,424 | 19,000 | 17.54 |
Sources: authors’ calculation based on Rating and Valuation Department; Hong Kong Annual Digest of Statistics, Census and Statistics Department, HKSAR Government.
Wong, Deng, and Cheung (2024) suggest that the observed pattern in HOS prices may be due to the existence of capital constraints for lower-income households. For many early-stage families, the decision to buy a starter home is more likely to be limited by inadequate financial resources, and they are therefore pushed towards the cheaper HOS market. Faced with such a limited choice of affordable options, Wong, Deng, and Cheung find that HOS secondary market prices are bid up by such buyers when compared to housing prices in the private market. For the same reason, they also find that this effect is larger for cheaper HOS flats, which enjoy larger government subsidies, and when general property prices become higher, reducing housing affordability for such capital-constrained households.
Based on government documentation, the official stated aims of HOS have not changed since its inception, and include the following two purposes: (a) to encourage better-off public rental housing (PRH) tenants to upgrade to homeownership so that public rental flats released by them could be allocated to other families in need of assisted housing; and (b) to provide an avenue to homeownership for middle-income households who are not eligible for public rental housing, and are unable to afford to buy private sector housing.[13]
Judging from the illustrated trends, it seems that subsidising home purchase through HOS is very useful in satisfying eligible households’ need to buy earlier. However, the housing authorities themselves recognise that HOS flats are not the final destination atop the housing ladder. Indeed, in the annual report of the Housing Authority in 2018/19, the special feature discussing HOS housing is titled “Enhancement of the Housing Ladder.”[14] To be able to allow new, low-income entrants into PRH, there needs to be a consistent outflow from HOS into the lower end of the market for private housing.
A number of studies have found that the subsidies given to HOS buyers have impeded the transition of households from HOS to the private market (Cheung and Wong 2020; Cheung et al. 2021; Li, Du, and Wu 2022). The main reason is that once an HOS flat is sold and the seller enters the private market, the government subsidy is lost. This happens regardless of the type of buyer. If the HOS flat is sold to a buyer eligible for HOS housing, then this secondary HOS market transaction does not involve repaying the subsidy, and sale prices are substantially below private market prices. If the flat is sold into the private market, then the subsidy must be repaid based on the transacted market price. Either way, to purchase the next home in the private market, the seller likely has to put in a sizable amount of extra financial resources.
Apart from issues relating to the transference of the subsidy, for smoother transition between the HOS and private market rungs on the housing ladder, it is desirable to have the prices of HOS flats moving more or less in step with small private flats. This is because movements in the relative price between these two classes affect how much financial resources are needed to move to the next better home. However, the structure of participants in the HOS and private markets are very different. Since its creation, eligibility to buy HOS housing has been carefully guarded by the government. Buyers of new HOS flats in the primary market must either be living in PRH (called the green form buyers), or if currently living in private housing, have income and assets below certain thresholds (called the white form buyers).[15]
For owners of new HOS flats, there are official regulations limiting the sale of their homes typically for several years after purchase. It is noticeable that public housing estates built in different years may be subject to such restrictions for different numbers of years.[16] That means that at different times, there is a chance that the HOS flats put on sale in the secondary market are of different ages and vintages, potentially delivering unexpected shocks to secondary HOS market prices. Additionally, changes in HOS eligibility and supply may not just affect secondary HOS market prices some years later, but also become an impulse into other steps on the housing ladder. Such a case is considered analytically in Ortalo-Magné and Rady (2006), and an earlier example in Hong Kong is raised by Ho and Wong (2006, 2008, 2009), who evaluate the impact of the Tenants Purchase Scheme from 1998, under which families living in PRH could purchase their flats at very large discounts. They concluded that the cheaper prices under this plan undermined the demand for other small flats, and HOS flats in particular. Coupled with the recessionary environment at the time, this policy had a negative effect on the Hong Kong economy.
Other direct HOS policy shocks also come into play. For example, faced with economic downturn and a large drop in property prices, the government stopped building new HOS estates in 2002, and it was not resumed until 2014 when the upward trend in property prices had been on course for several years. In 2013, faced with sustained house price inflation and worsening affordability, the White Form Secondary Market (WSM) Scheme was introduced. The scheme allows several thousand white form applicants, who previously could only buy new HOS flats, into the secondary HOS market. Doing so allows such households an extra choice of subsidised housing to choose from and increases the chance that they can become subsidised homeowners. This scheme was implemented again in 2015 and has become an annual exercise since 2018. These policies may exert an idiosyncratic influence on the prices of secondary HOS flats, in addition to other general economic factors.
Using the WSM Scheme as an exogenous policy shock on the HOS secondary market, Cheung, Wong, and Yiu (2023) find that after the scheme’s implementation, there has been a significant increase in transaction liquidity in the HOS secondary market. In particular, flats with a larger percentage of government subsidy were more actively traded after the policy was implemented. Interpreting the results from a behavioural science angle, the authors argue that the increased chance to sell their HOS flats increased the exchange nature of such flats to the sellers, thus reflecting the existence of the endowment effect.
Empirical analysis on housing prices
To check whether the factors highlighted above have brought HOS secondary market prices away from trends in the wider private market, we carry out an empirical analysis to look into the influence of a number of micro- and macroeconomic variables on HOS and private property prices. The variables included are commonly thought to be influential to the real estate market and are described in the following paragraphs.
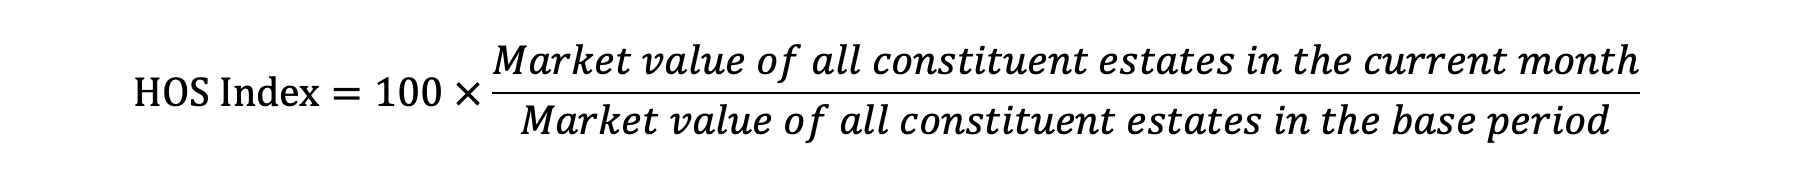
HOS secondary market prices (HOS_INDEX): The subsidised HOS housing prices traded in the secondary market are measured by the HKMU HOS Price Index (Ma, Cheung, and Lo forthcoming). This index traces the market value of 50 selected constituent HOS estates with the highest transaction volumes and captures the market value of transactions in these constituent estates in different periods in order to reflect the trend in prices. The index adopts a structure in the form of the following equation:
Private property market (RVD_A and RVD_ALL): We employ two property price indices constructed by the Rating and Valuation Department (RVD) of the government – RVD Index (A) and RVD Index (All). The RVD Index (A) covers private residential units with saleable area less than 40 m2. This index is chosen to provide direct comparison with the subsidised HOS flats, as most HOS flat sizes fall into this category. We also include in our analysis the RVD Index (All), which covers private residential units of any saleable area as a robustness check to see if the determinants of property prices we selected are robust across flats of different sizes. When used in the estimations in logged form, they are represented by LN_RVD_A and LN_RVD_ALL respectively.
We follow the model of Wong et al. (2021) and Leung, Chow, and Han (2008) to select a range of demand- and supply-side variables as the determinants of subsidised and private property prices. For the demand-side measures, we employ the RVD Rental Index for Class A and all private properties taken from the Rating and Valuation Department (LN_RENT_A and LN_RENT_ALL), gross domestic product per capita (LN_GDP), domestic credit[17] (LN_LOCAL_LOAN), and market interest rate as measured by the 3-month Hong Kong Interbank Offered Rate (HIBOR_3M). For supply-side measures, we include the supply of private residential units (LN_PRI_SUPPLY) and supply of subsidised residential flats (LN_SUB_SUPPLY). For the subsidised housing price determinants, we also include a dummy variable for the WSM Scheme, which equals 1 for the quarter in which the participants receive their official Certificate of Eligibility to Purchase (CEP) and become eligible to enter the HOS secondary market.[18] Lastly, the government-published Composite Consumer Price Index (LN_CCPI) is included to control for changes in the general price level. Table 2 contains the definitions of the variables and sources of data, while Table 3 presents the summary statistics. All variables are expressed in natural logarithms in the estimation, with the exception of the interest rate and WSM dummy variable.
Table 2. Definitions of variables
| Variable | Definition |
| HOS_INDEX | HKMU HOS Price Index (Ma, Cheung, and Lo forthcoming). An index that traces the prices of HOS flats transacted in the secondary market. This serves as a proxy for the price of subsidised housing. |
| LN_HOS | Natural logarithm of the HKMU HOS Price Index. |
| RVD_A | The RVD Property Price Index A, an index constructed by the Rating and Valuation Department, which traces the private domestic property price of Class A units with saleable area less than 40 m2 (rebased 2013 = 100). |
| LN_RVD_A | Natural logarithm of the RVD Property Price Index A. |
| RVD_ALL | The RVD Property Price Composite Index, an index constructed by the Rating and Valuation Department, which traces the prices of all properties traded in the private market (rebased 2013 = 100). |
| LN_RVD_ALL | Natural logarithm of the RVD Property Price Composite Index. |
| LN_RENT_A | Natural logarithm of the RVD Rental Index A. An index constructed by the Rating and Valuation Department, which traces the private domestic residential rent of Class A units, with saleable area less than 40 m2. |
| LN_RENT_ALL | Natural logarithm of the RVD Rental Index A. An index constructed by the Rating and Valuation Department, which traces the private domestic residential rent of all residential properties. |
| LN_GDP | Natural logarithm of GDP per capita in Hong Kong, calculated by nominal GDP divided by population. Data from the Census and Statistics Department. |
| LN_CCPI | Natural logarithm of the Composite Consumer Price Index, which traces the local inflation rate. Data from the Census and Statistics Department. |
| LN_PRI_SUPPLY | Natural logarithm of private residential units established in the quarter. Data from the Census and Statistics Department. |
| LN_SUB_SUPPLY | Natural logarithm of subsidised residential units established in the quarter. Data from the Census and Statistics Department. |
| LN_LOCAL_LOAN | Natural logarithm of domestic credit, as proxy for the liquidity in the banking system. Data from the Hong Kong Monetary Authority. |
| HIBOR_3M | Hong Kong Interbank Offered Rate (3-month), which serves as a proxy for the domestic interest rate. Data from the Hong Kong Monetary Authority. |
| WSM_Q1 | Dummy variable equals 1 for the quarter period in which the WSM Scheme participants became eligible to enter the HOS secondary market (applicants received their official Certificate of Eligibility to Purchase (CEP)), zero otherwise. |
| HOS_TRAN | The number of transactions in the HOS secondary market in the current quarter. |
| LN_HOS_TRAN | Natural logarithm of the number of transactions in the HOS secondary market in the current quarter. |
Source: authors.
Table 3. Summary statistics
| Variable | Mean | SD | Min | Max |
| HOS Index | 123.9737 | 64.08323 | 37.92667 | 216.37 |
| RVD A | 110.8999 | 50.10316 | 33.80 | 178.38 |
| RVD ALL | 109.8906 | 45.89948 | 39.05 | 171.23 |
| Rental Index A | 162.2757 | 41.89254 | 86.4 | 220.9667 |
| Rental Index ALL | 151.8743 | 33.73776 | 89.26667 | 198.6 |
| GDP/capita | 78128.89 | 14991.93 | 51821.76 | 101634.4 |
| CCPI | 86.79286 | 12.32828 | 66.86667 | 105.1333 |
| Subsidised housing supply | 618.1429 | 1185.622 | 0 | 5000 |
| Private housing supply | 3460.471 | 1949.061 | 236 | 8307 |
| Local loan | 14990.16 | 5994.428 | 6334.792 | 23869.46 |
| HIBOR 3-month | 1.733619 | 1.360232 | 0.15 | 4.826667 |
Source: authors.
The estimation horizon is from 2006 quarter 1 to 2023 quarter 2 for all models. Since there is reason to believe that many of the variables we intend to use are nonstationary, there is the possibility that we are facing cointegrating relationships. Therefore, we employ the Augmented Dickey-Fuller test for each variable to test for their stationarity, and results show that most of the variables are indeed nonstationary. As the use of the ordinary least squares (OLS) model on nonstationary variables may result in spurious regressions, we instead employ the error correction model (ECM) to study the determinants of property prices in the private and subsidised markets.
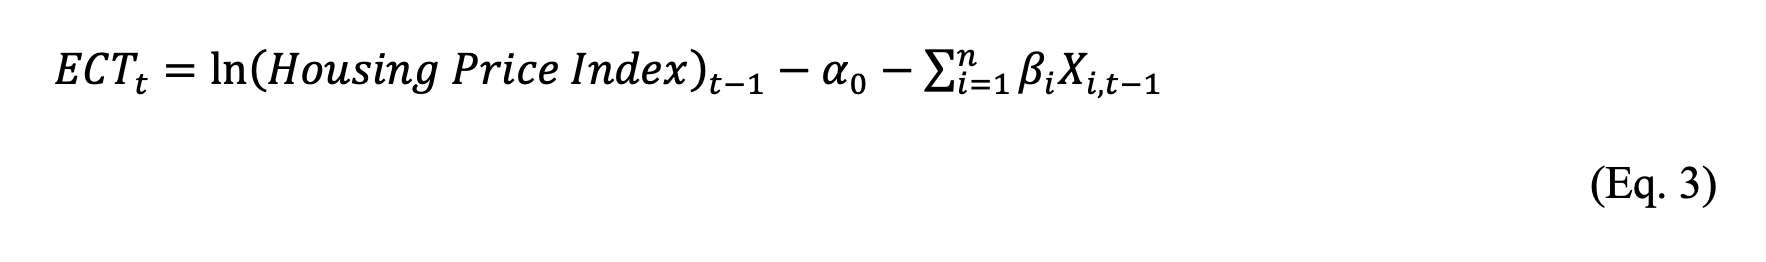
The long run equation is specified as follows:
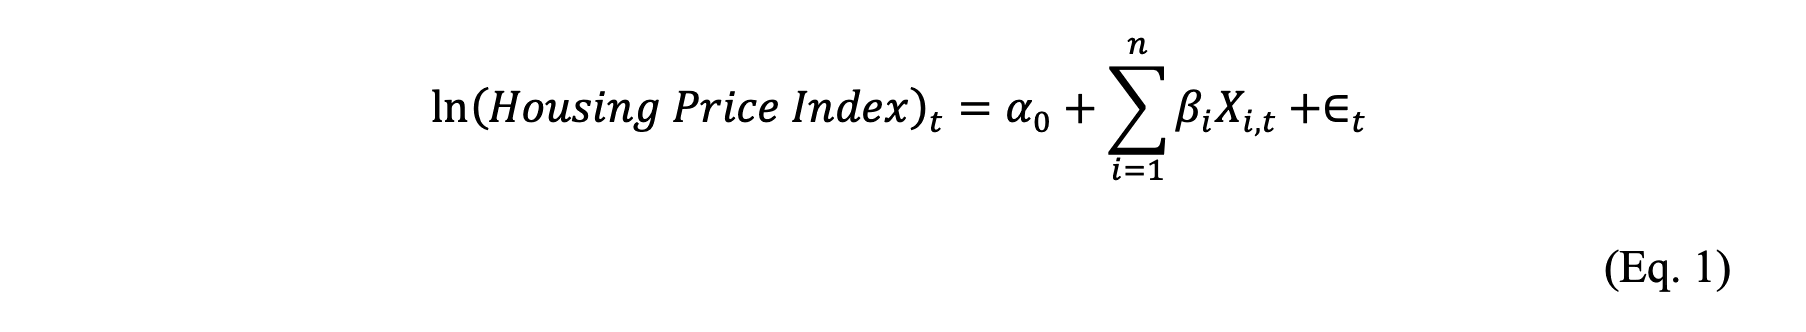
The ECM can be represented by the following equations:
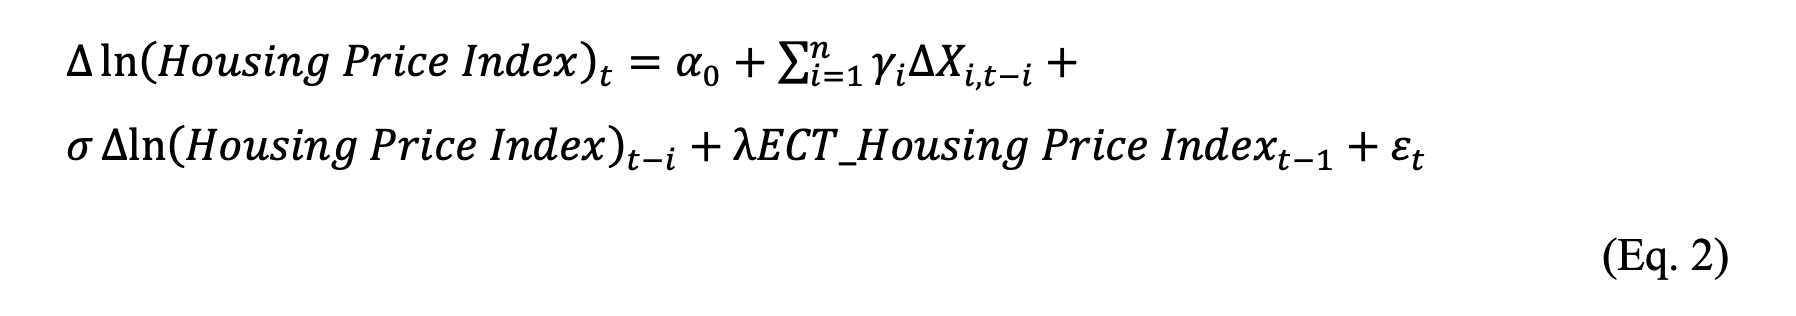
To look at the behaviour of different kinds of properties, we use LN_HOSt, LN_RVD_At, and LN_RVD_ALLt for ln(Housing Price Index)t. The error correction terms (ECTs) are extracted from the residuals of the long run regression equation of each model and show how the deviations from the equilibrium relationship in the previous period will be corrected in the current period:
The coefficients of the ECTs measure how fast the variables will adjust back to the long run equilibrium value after deviating from trend. We estimate the above equations by using the HOS Index (Model 1), RVD Index A (Model 2), and overall RVD Index (All) (Model 3). Table 4 presents the results of the unit root test and the lag order for each variable as determined by Akaike's Information Criterion (AIC). To check if the variables are cointegrated in each model, we run a unit root test on each of the ECTs in Models 1, 2, and 3. Table 5 presents the results showing no unit root in any of the ECTs.
Table 4. Lag order and Augmented Dickey-Fuller unit root test results
| (c, t, L) | Level | 1st difference | |
| Ln_HOS | (c, t, 2) | -2.083 | -4.510*** |
| Ln_RVD_A | (xc, t, 3) | -2.772* | -4.607*** |
| Ln_RVD_ALL | (c, t, 3) | -2.431 | -4.840*** |
| Ln_RENT_A | (c, t, 3) | -2.630* | -4.573*** |
| Ln_RENT_ALL | (c, t, 3) | -2.261 | -4.477*** |
| Ln_GDP | (c, t, 4) | -1.907 | -8.264*** |
| Ln_CCPI | (c, t, 4) | -1.145 | -9.914*** |
| Ln_PRI_SUPPLY | (c, t, 0) | -7.450*** | -12.804*** |
| Ln_PUB_SUPPLY | (c, t, 2) | -6.481*** | -15.129*** |
| Ln_LOCAL_LOAN | (c, t, 3) | -2.163 | -5.746*** |
| HIBOR_3M | (c, t, 2) | -1.645 | -6.129*** |
Note: lag order selection was determined by Akaike’s information criterion. Test statistics for levels and first differences are presented. *, **, and *** denote statistical significance at 10%, 5%, and 1%, respectively.
Source: authors.
Table 5. Lag order and Augmented Dickey-Fuller unit root test results for the residuals of the long run equations
| Lags | Level | |
| Residual for HOS (Model 1) | 0 | -8.436*** |
| Residual for RVD A (Model 2) | 0 | -8.470*** |
| Residual for RVD ALL (Model 3) | 0 | -8.088*** |
Note: lag order selection was determined by Akaike’s information criterion. Test statistics are presented under the Level column. *, **, and *** denote statistical significance at 10%, 5%, and 1%, respectively.
Source: authors.
Table 6 also indicates that the coefficients of all ECTs are negative and statistically significant, suggesting that the variables in each model are cointegrated and the dependent variables will adjust back to the long run equilibrium.
Table 6. House prices in the short run equilibrium relationship (HOS)
| Model (1) | Model (2) | Model (3) | |
| Variables | ΔLN_HOS | ΔLN_RVD_A | ΔLN_RVD_ALL |
| ECTt-1 | -0.195** | -0.389*** | -0.455*** |
| (0.0934) | (0.134) | (0.142) | |
| ΔLN_HOSt-1 | 0.323* | ||
| (0.164) | |||
| ΔLN_RVD_A t-1 | 0.264 | ||
| (0.183) | |||
| ΔLN_RVD_A t-2 | -0.00471 | ||
| (0.153) | |||
| ΔLN_RENT_A | 0.419* | 0.566** | |
| (0.230) | (0.255) | ||
| ΔLN_RENT_A t-1 | -0.0785 | -0.269 | |
| (0.221) | (0.268) | ||
| ΔLN_RENT_A t-2 | -0.188 | -0.271 | |
| (0.235) | (0.232) | ||
| ΔLN_RVD_ALL t-1 | 0.146 | ||
| (0.181) | |||
| ΔLN_RVD_ALL t-2 | 0.136 | ||
| (0.153) | |||
| ΔLN_RENT_ALL | 0.817*** | ||
| (0.219) | |||
| ΔLN_RENT_ALL t-1 | -0.539** | ||
| (0.241) | |||
| ΔLN_RENT_ALL t-2 | -0.199 | ||
| (0.192) | |||
| ΔLN_GDP | -0.319 | -0.0865 | -0.0104 |
| (0.275) | (0.204) | (0.219) | |
| ΔLN_GDP t-1 | -0.103 | -0.00577 | 0.0593 |
| (0.246) | (0.173) | (0.189) | |
| ΔLN_GDP t-2 | -0.00265 | 0.133 | 0.188 |
| (0.199) | (0.143) | (0.158) | |
| ΔLN_GDP t-3 | 0.000509 | 0.0339 | 0.0464 |
| (0.161) | (0.130) | (0.141) | |
| ΔLN_CCPI | -0.648 | 0.0348 | 0.165 |
| (0.487) | (0.403) | (0.429) | |
| ΔLN_CCPI t-1 | -1.072** | -0.476 | -0.481 |
| (0.479) | (0.386) | (0.413) | |
| ΔLN_CCPI t-2 | -0.575 | -0.998** | -0.835** |
| (0.512) | (0.378) | (0.406) | |
| ΔLN_CCPI t-3 | -0.283 | 0.0746 | 0.0322 |
| (0.431) | (0.405) | (0.432) | |
| ΔLN_SUB_SUPPLY | 0.00119 | ||
| (0.00219) | |||
| ΔLN_SUB_SUPPLY t-1 | 0.000307 | ||
| (0.00137) | |||
| ΔLN_LOCAL_LOAN | 0.364* | 0.0574 | 0.0743 |
| (0.203) | (0.187) | (0.204) | |
| ΔLN_LOCAL_LOAN t-1 | -0.120 | 0.0740 | -0.00853 |
| (0.206) | (0.183) | (0.192) | |
| ΔLN_LOCAL_LOAN t-2 | 0.0691 | -0.115 | -0.317* |
| (0.199) | (0.180) | (0.186) | |
| ΔLN_HIBOR_3M | -0.0209** | -0.0114 | -0.0106 |
| (0.00900) | (0.00700) | (0.00780) | |
| ΔLN_HIBOR_3Mt-1 | 0.0138 | 0.00993 | 0.0100 |
| (0.00910) | (0.00744) | (0.00841) | |
| Constant | -1.882 | -3.193** | -3.264** |
| (1.702) | (1.504) | (1.605) | |
| Observations | 66 | 66 | 66 |
| R-squared | 0.784 | 0.841 | 0.823 |
Note: numbers in parenthesis are standard errors. *, **, and *** denote statistical significance at 10%, 5%, and 1%, respectively. The selection of lag order is based on AIC criteria.
Source: authors.
Table 7 presents the results of the long run regression models. We can observe that none of the coefficients of the supply-side factors is statistically significant, implying that property prices in Hong Kong are mainly demand driven. For the demand side factors, the coefficients of the rental indices (LN_RENT_A and LN_RENT_ALL) are positive and statistically significant in all models. This result is consistent with Wong et al. (2021) and suggests that rental prices have a significant impact on both the private and subsidised property markets. Higher rent not only increases the user cost of property, but also implies a higher rental yield, which encourages potential home buyers to purchase property for accommodation or investment. The resultant higher demand may drive up property prices in both markets. On the other hand, the coefficients of GDP per capita are not significant in any model. The result is partially consistent with Wong et al. (ibid.), which also shows that GDP per capita is not significant when properties are divided into high-price and low-price segments. Such results can be explained by the fact that the property prices have increased much faster than income in the estimation horizon. From 2006 to 2019, the RVD Index (A) increased by nearly 400%, while the nominal wage index rose by just 65% according to the Census and Statistics Department. This suggests that income is not a key factor in driving demand for property, which can be corroborated by the fact that many first-time home buyers need to rely on other sources of finance (for example, family support and/or large mortgages) in order to afford a property in Hong Kong. Over the past four years, the property price indices have been dropping while the nominal wage index increased. We can see that the property price cycle does not match that of income regardless of the direction of the trend.
As for the interest rate and domestic credit, two of the most important factors that affect demand on the real estate market, the coefficients are only statistically significant in Models 2 and 3 (the private market) with the expected sign. This finding implies that the trend of subsidised property prices does not depend on credit market conditions. Since mortgages are almost ubiquitous in purchasing real estate, movements in interest rates and the availability and size of mortgages are almost always the most sensitive factors in property purchase decisions. A higher interest rate increases the cost of mortgages, but at the same time it raises the return on other assets such as deposits and bonds, thus exerting a heavy influence on demand for housing. The insignificance of these two variables on the HOS Index suggests that the subsidised property market in Hong Kong is probably under some influence that makes it unresponsive to these important market determinants. Lastly, the coefficient for the WSM Scheme is not significant, suggesting that there is no clear direction on how the WSM Scheme will affect subsidised house prices. Even though the WSM Scheme allows more participants into the HOS secondary market and increases demand, the details of every annual implementation of the WSM Scheme are announced earlier, and market participants are well-informed about this policy beforehand. As a result, this may mitigate the ability of the WSM dummy variable, which reflects only the period when WSM Scheme applicants receive their CEP, to correlate with HOS prices.[19]
Table 7. House prices in the long run equilibrium relationship
| Model (1) | Model (2) | Model (3) | |
| Variables | LN_HOS | LN_RVD_A | LN_RVD_ALL |
| LN_RENT_A | 1.713*** | 1.242*** | |
| (0.491) | (0.183) | ||
| LN_RENT_ALL | 1.149*** | ||
| (0.230) | |||
| LN_GDP | 0.141 | -0.219 | 0.0404 |
| (1.243) | (0.467) | (0.520) | |
| LN_CCPI | -0.132 | -0.648 | -0.236 |
| (1.813) | (0.821) | (0.813) | |
| LN_PRI_SUPPLY | 0.00323 | 0.00413 | |
| (0.0123) | (0.0130) | ||
| LN_SUB_SUPPLY | -0.0108 | ||
| (0.0153) | |||
| LN_LOCAL_LOAN | 0.293 | 0.718*** | 0.520* |
| (0.669) | (0.249) | (0.260) | |
| HIBOR_3M | -0.0196 | -0.0320*** | -0.0291*** |
| (0.0247) | (0.00883) | (0.0100) | |
| WSM_Q1 | -0.0630 | ||
| (0.0821) | |||
| Observations | 66 | 66 | 66 |
| R-squared | 0.784 | 0.823 | 0.841 |
Note: numbers in parenthesis are standard error. *, **, and *** denote statistical significance at 10%, 5%, and 1%, respectively.
Source: authors.
The above results, therefore, suggest that the determinants of private and subsidised housing prices are not the same. The earlier discussion about eligibility for subsidised housing may offer an explanation for this finding. The regulations that constrain entry into and exit from HOS housing are nonmarket factors of considerable heft. While from time to time the government does make changes to regulations such as entrance requirements, rate of discount, and even resale restrictions to reflect market conditions, they may not be made in time. Crucially, the changes may not adjust in the same direction as private market trends, because the main objective of such changes is frequently to take care of the affordability of HOS for eligible households, in answer to the government’s own purpose for the role of HOS. Catering to these objectives may have distorted the subsidised market to a point, leading to the misalignment of subsidised housing and private property prices. Potentially, this can make it difficult for HOS owners to advance on the housing ladder. Taking the Covid-19 period (January 2020 to June 2023) as an example, the RVD Index (All) dropped by 8.53% while the HOS Index sank much more at 19.33% (Table 8). For households that bought HOS flats in the few years just before HOS prices reached their peak, it becomes difficult for them to consider advancing up the housing ladder as the price trend of the properties they own has fallen behind that of private housing.
Table 8. Changes in various property price indices in Hong Kong (2006-2023)
| Time period | HOS Index | RVD Index (All) | RVD Index (A) |
| January 2006 to December 2019 | 436.03% | 317.62% | 399.76% |
| January 2020 to June 2023 | -19.33% | -8.53% | -10.19% |
| January 2006 to June 2023 | 352.14% | 278.85% | 343.76% |
| January 2006 to December 2012 | 153.19% | 150.66% | 188.70% |
| January 2013 to June 2023 | 72.88% | 49.38% | 52.37% |
Sources: authors’ calculations based on figures from the Rating and Valuation Department, HKSAR Government.
The above scenario suggests that the higher volatility in HOS prices may deter advancement up the housing ladder. In the face of rapidly rising private property prices, discounted HOS flats with such regulated entry can allow households in the lower part of the income distribution to buy their homes earlier. However, as seen in Figure 1, HOS housing prices undergo even larger fluctuations and are more volatile. For the horizon of the empirical estimation between 2006 to 2023, when rebased to 100 in January 2013, the standard deviation of the HOS Price index is 63.80, considerably higher than that of the RVD Index (A) at 50.10 (Table 9). Potentially speaking, the more volatile HOS prices in the secondary market, coupled with losing the subsidy when moving to private housing, the smaller the ability of HOS to bridge the housing ladder between PRH and the private market. That implies that once onboard HOS housing, residents tend to stay there and not move to the private market, making it more difficult for other families in the queue for HOS and PRH housing.
Table 9. Standard deviations of various property price indices in Hong Kong (2006-2023)
| Time period | HOS Index | RVD Index (All) | RVD Index (A) |
| January 2006 to December 2019 | 57.59 | 42.08 | 46.05 |
| January 2020 to June 2023 | 16.12 | 7.81 | 8.84 |
| January 2006 to June 2023 | 63.80 | 45.90 | 50.10 |
| January 2006 to December 2012 | 17.42 | 17.22 | 18.41 |
| January 2013 to June 2023 | 36.28 | 23.30 | 25.12 |
Sources: authors’ calculations based on figures from the Rating and Valuation Department, HKSAR Government.
As described earlier, one of the most influential policy changes in the recent development of the HOS secondary market is the WSM Scheme. Even though the regression results do not indicate it having a significant effect on HOS prices (see Table 7), it is important to examine if this policy has other effects on the subsidised housing market. Based on the volatility of various property price indices in Table 9, we perform an Analysis of Variance (ANOVA) test to compare if the variances between the HOS Index, RVD Index (All), and RVD Index (A) are significantly different from each other. Table 10a shows the comparison before the WSM Scheme was implemented, and the test-statistic shows that the variances are not significantly different. Table 10b runs the same test for the period after the WSM Scheme was implemented. The Bartlett’s equal-variances test show the difference in variance is statistically significant, suggesting that the implementation of the WSM Scheme may have increased volatility in the HOS secondary market.
Table 10a. ANOVA for the period before the WSM Scheme was implemented (2006-2012)
| Mean | Standard deviation | Frequency (monthly) | |
| HOS_INDEX | 55.261 | 17.418 | 84 |
| RVD_ALL | 60.044 | 17.221 | 84 |
| RVD_A | 56.281 | 18.411 | 84 |
| Total | 57.195 | 17.740 | 252 |
| Source | Sum of squares | Degrees of freedom | Mean squares | F | Prob > F | |
| Between groups | 1,066.179 | 2 | 533.0897 | 1.7 | 0.1842 | |
| Within groups | 77,929.612 | 249 | 312.9703 | |||
| Total | 78,995.791 | 251 | 314.724 |
Note: Bartlett’s equal-variances test: chi2(2) = 0.4267 Prob > chi2 = 0.808.
Source: authors.
Table 10b. ANOVA for period before WSM Scheme was implemented (2013-2023)
| Mean | Standard deviation | Frequency (monthly) | |
| HOS_INDEX | 169.782 | 36.285 | 126 |
| RVD_ALL | 143.121 | 23.295 | 126 |
| RVD_A | 147.310 | 25.116 | 126 |
| Total | 153.404 | 31.033 | 378 |
| Source | Sum of squares | Degrees of freedom | Mean squares | F | Prob > F | |
| Between groups | 51,800.967 | 2 | 25,900.484 | 31.2 | 0.0000 | |
| Within groups | 311,258.464 | 375 | 830.023 | |||
| Total | 363,059.431 | 377 | 963.022 |
Note: Bartlett’s equal-variances test: chi2(2) = 29.6531 Prob > chi2 = 0.000.
Source: authors.
The transaction volume data of the two markets, shown in Figures 2 and 3, also display very different trends. Prior to the WSM Scheme between 2006 to 2012, the correlation between transaction volumes of secondary HOS flats and private properties shows a Pearson correlation coefficient of positive 0.5353, which can be considered moderately correlated. In the period after the WSM Scheme was put in place (January 2013 to June 2023), the coefficient drops practically to zero at positive 0.0433. When comparing the price trend of secondary HOS prices in Figure 3 and the information in Table 11, which shows the different phases of WSM participation, we also find (in column three of Table 11) that transaction volumes increased significantly in the month after WSM Scheme participants became eligible to enter the market. For example, the CEP of WSM 2020 was released in May 2021, and the transaction volume in the next month hit a historical high of 652 (compared with the average of 158.84 for the whole estimation horizon between 2006 and 2023). Column four of Table 11 shows the 12-month average transaction volume, counting six months either side of the measurement in column three. They show clearly the spike in transaction volumes due to the entrance of WSM buyers.
Table 11. WSM Scheme and the transaction volume in HOS secondary market
| Certificate of Eligibility to Purchase release date | Transaction volume for the month after the release date | Average transaction volume six months before and after the month of release | |
| WSM 2013 | May 2013 | 445 | 144.77 |
| WSM 2015 | January 2016 | 168 | 104.50 |
| WSM 2018 | October 2018 | 193 | 148.38 |
| WSM 2019 | January 2020 | 233 | 141.62 |
| WSM 2020 | May 2021 | 652 | 208.77 |
| WSM 2022 | November 2022 | 442 | 249.54 |
Source: Hong Kong Housing Authority.
Figure 2. Transaction volume of HOS flats in the secondary market 2006-2023 (number of flats)
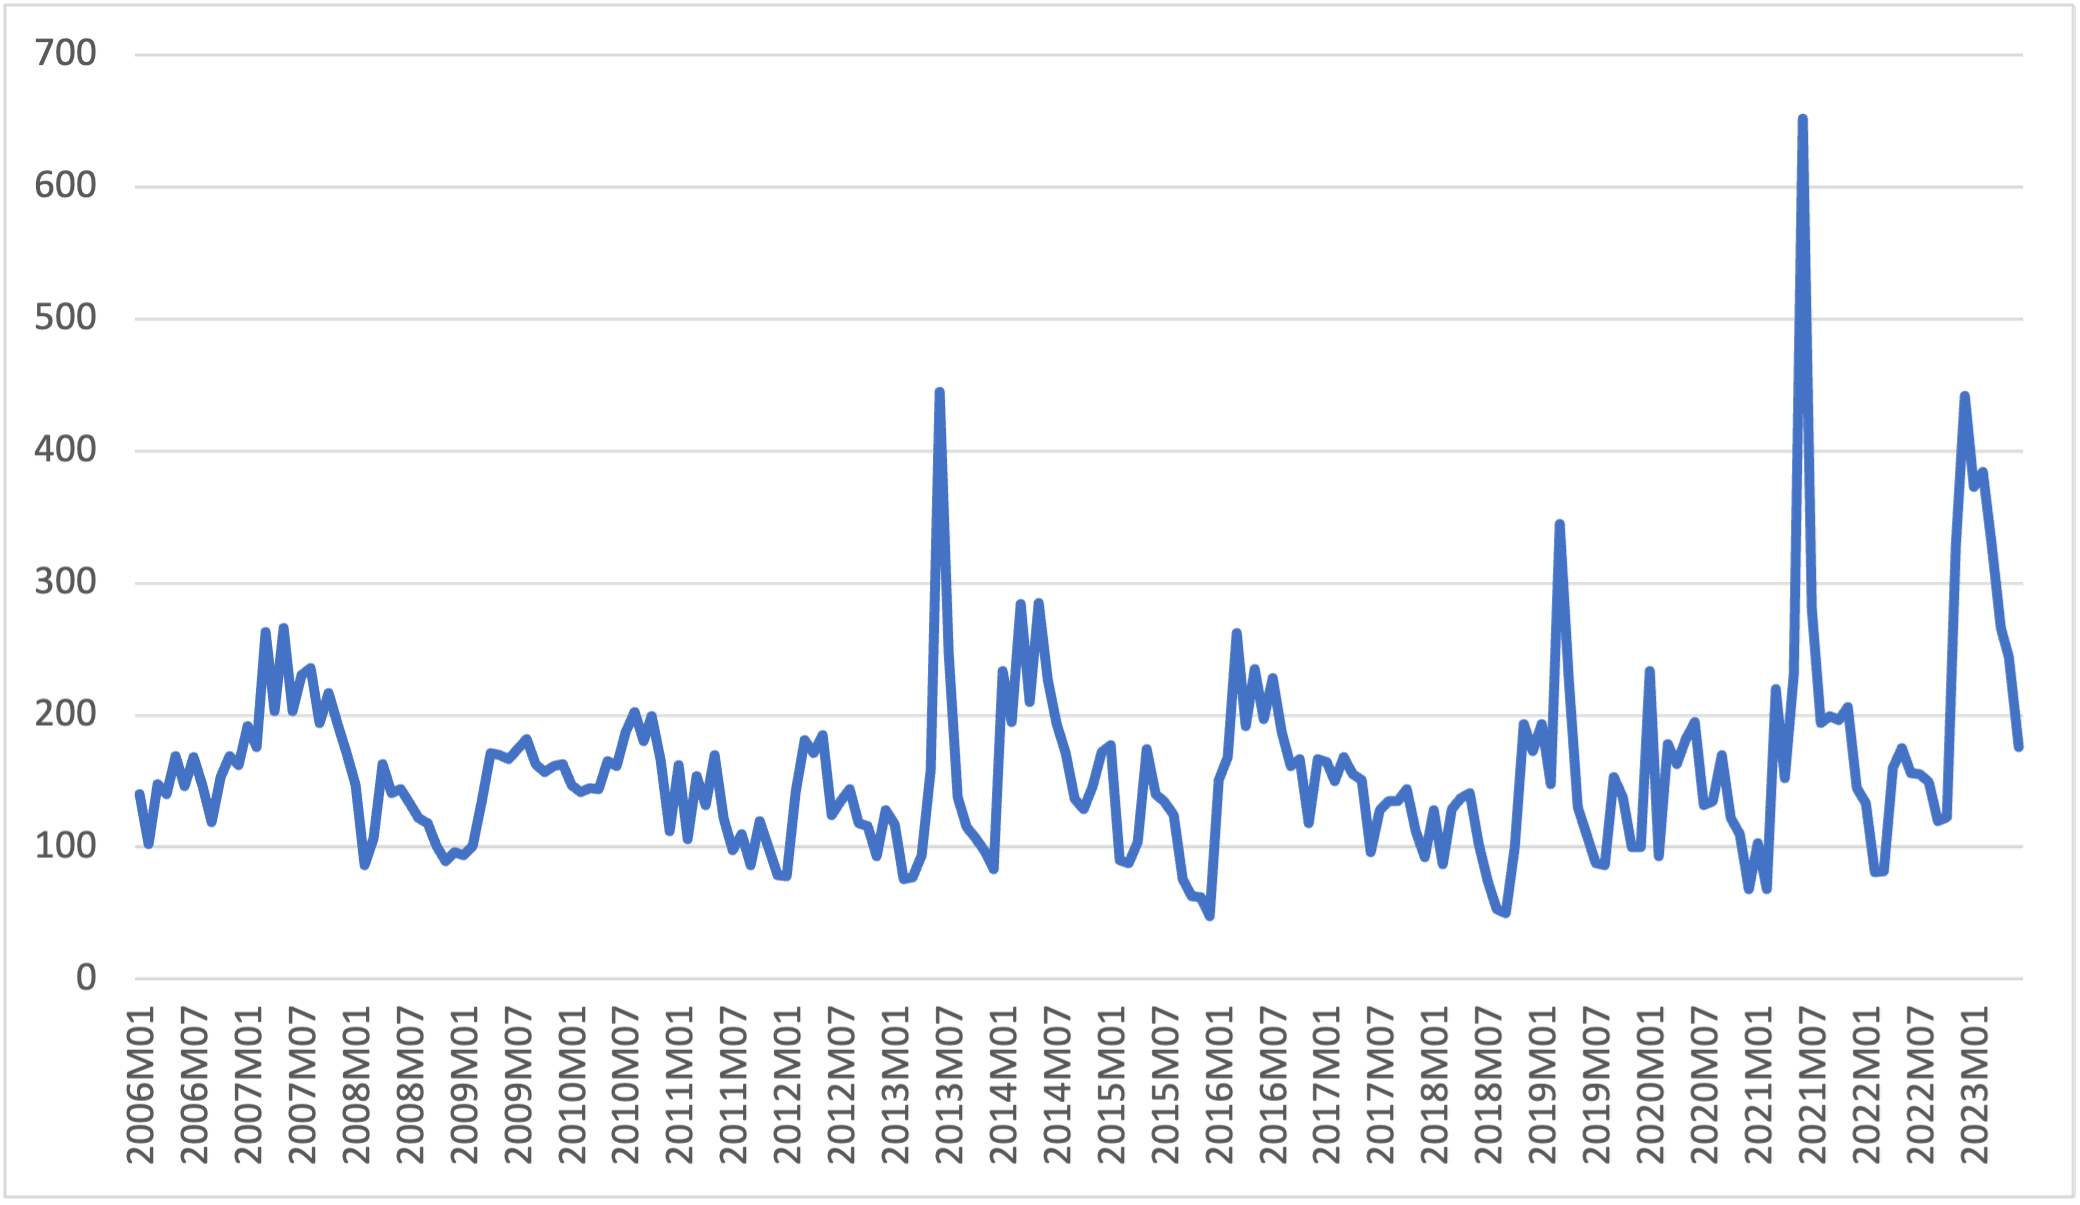
Note: vertical line represents the year when the WSM Scheme was implemented in 2013.
Source: Hong Kong Housing Authority.
Figure 3. Transaction volume of private property 2006-2023 (number of flats)
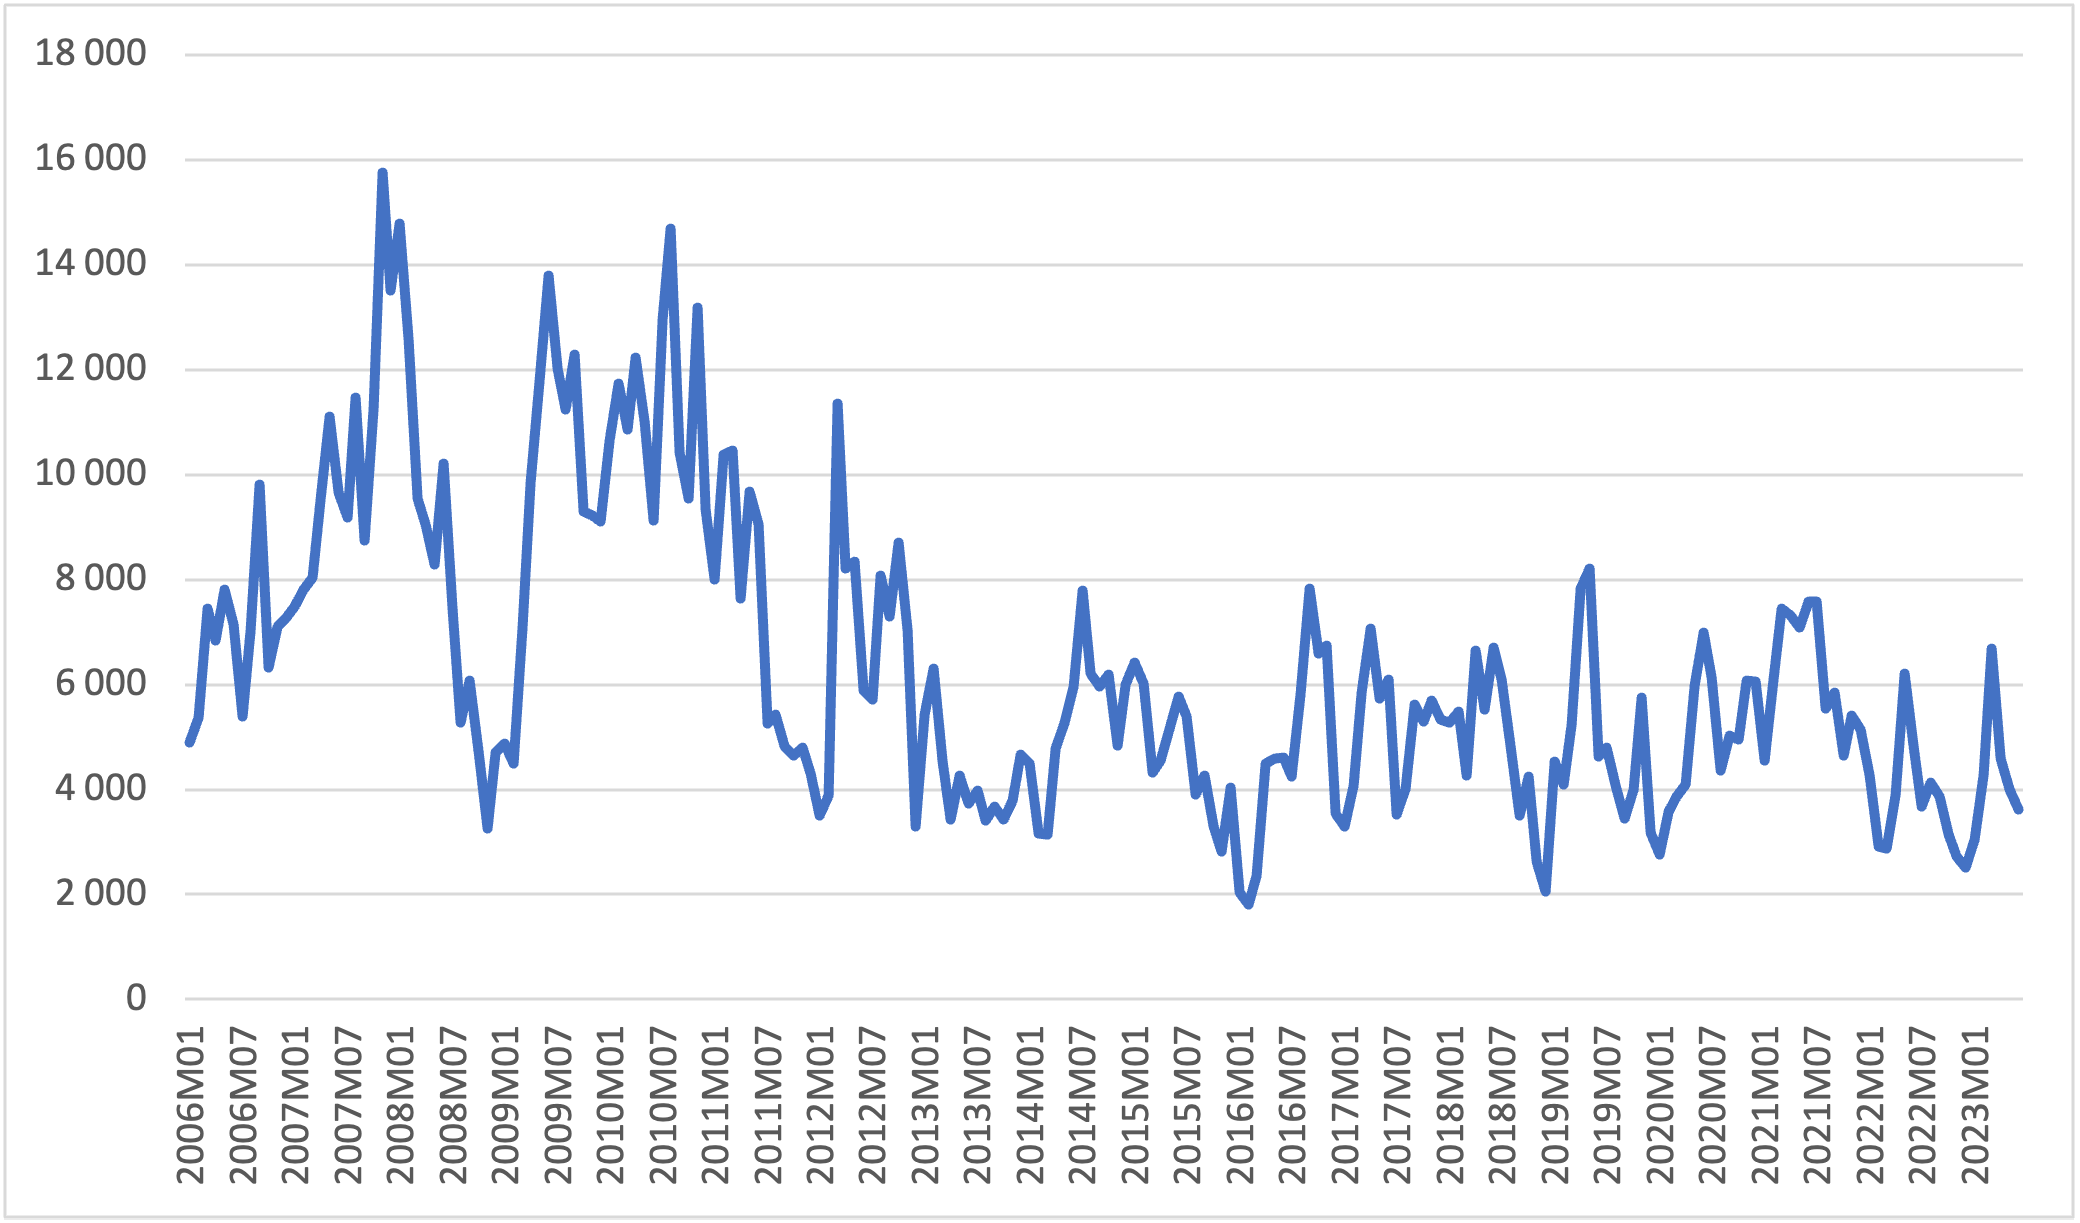
Note: vertical line represents the year when the WSM Scheme was implemented in 2013.
Source: Hong Kong Housing Authority.
We explore further by investigating changes in transaction volumes for the HOS secondary market by employing the OLS regression model as below:
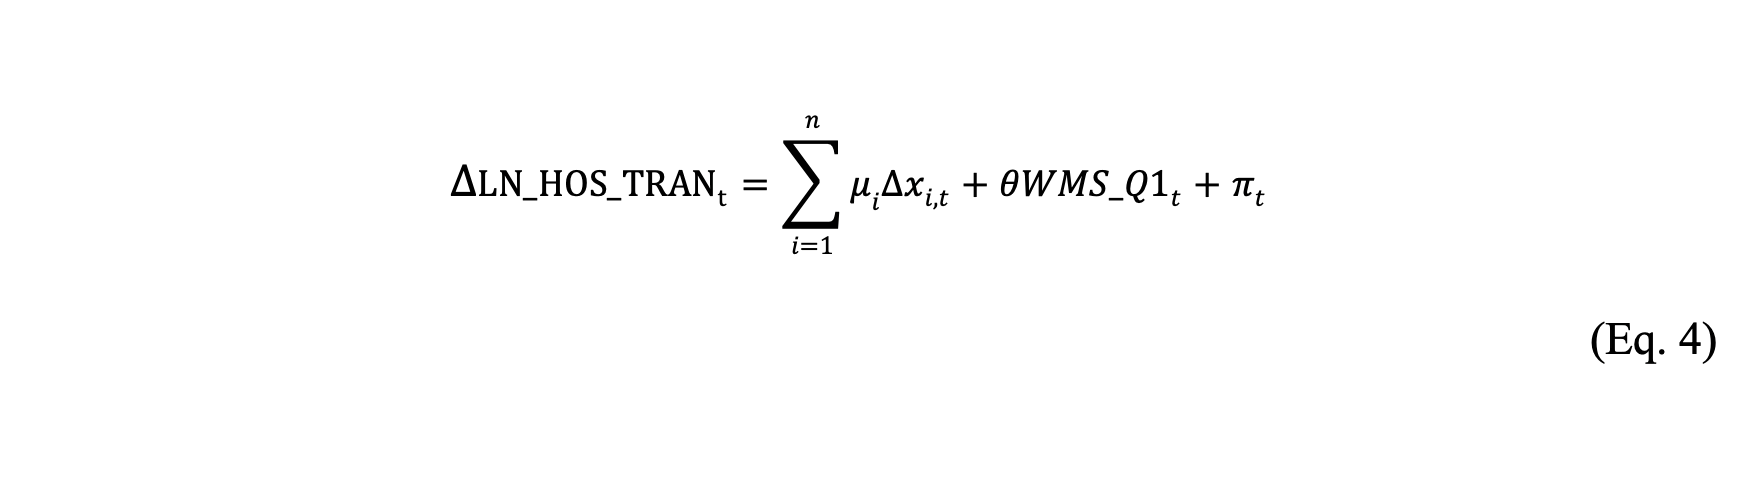
The dependent variable is the change in transaction volume in the HOS secondary market. The control variables are: change in the rental index, change in GDP per capita, change in domestic credit, change in CCPI, and the WMS Scheme dummy variable (WSM_Q1). All variables are expressed in natural logarithms with the exception of the WSM dummy. Table 12 presents the regression results, and it shows that the coefficients of WSM_Q1 are positive and statistically significant. For the quarter where the applicants can enter the HOS secondary market, the transaction volume increases by around 42.9% (column 2). The negative significance of changes in per capita income may be because in periods of higher income growth, some buyers may have moved to the private market as their income prospects improved. We also test if the effect of the WSM policy or changes in income will last for more than one quarter by introducing their lagged terms into the regression. In column 3, the insignificant coefficients suggest that the effect of the WSM Scheme and income changes in affecting the transactions of HOS flats last only one quarter. These findings suggest that the WSM Scheme has successfully alleviated the issue of illiquidity of HOS housing, but it does so by increasing transaction volumes drastically on a periodic basis, reducing the correlation between the private and HOS housing markets.
Table 12. Determinants of HOS secondary market transactions
| (1) | (2) | |
| Variables | ∆Ln_HOS_Transact | ∆Ln_HOS_Transact |
| ∆LN_RENT_A | -0.659 | -0.689 |
| (1.642) | (1.732) | |
| ∆LN_GDP | -2.259*** | -2.101*** |
| (0.713) | (0.726) | |
| ∆LN_GDP t–1 | -0.708 | |
| (0.781) | ||
| ∆LN_CCPI | -3.709 | -1.446 |
| (3.671) | (4.307) | |
| ∆LN_LOCAL_LOAN | 2.349 | 2.084 |
| (1.891) | (1.914) | |
| ∆LN_LOCAL_LOAN | 0.126 | 0.125 |
| (0.0881) | (0.0903) | |
| WMS_Q1 | 0.429*** | 0.466*** |
| (0.146) | (0.149) | |
| WMS_Q1 t–1 | 0.157 | |
| (0.146) | ||
| Constant | -0.0274 | -0.0537 |
| (0.0614) | (0.0646) | |
| Observations | 69 | 68 |
| R-squared | 0.312 | 0.337 |
Note: numbers in parenthesis are standard error. *, **, and *** denote statistical significance at 10%, 5%, and 1%, respectively.
Source: authors.
Conclusion
Social housing is almost half of the housing stock in Hong Kong, forming the lower rungs of the housing ladder and often the early steps of households’ housing trajectories. Given the very high housing prices in the private sector, it offers a useful alternative for less well-endowed households. As the Housing Authority laments, “[t]he fundamental solution to Hong Kong’s imbalance of housing supply and demand is to increase the supply of housing, including public housing.”[20] However, with large, sometimes lifelong, subsidies, there is always keen demand for social housing, and without some better-off incumbents moving out, it is difficult for the government to provide enough of it.
For HOS households to move to the private sector, the HOS flat must be sold. Whether or not the income and asset status of the buyer requires the seller to repay the government subsidy, a large financial outlay is still needed to buy a private dwelling. If the price trends of private and HOS properties are not aligned, then it introduces uncertainty into the budgets of these households, and may hinder their efforts to buy into the private sector. Using a price index for HOS secondary market transactions for comparison, we find that when property prices rise, HOS prices rise even more, and when property prices trend down, HOS prices also undergo steeper falls. Using an error correction model, we also find that the interest rate, domestic credit, and rental value are significantly related to private housing prices in a long-run relationship, but they are largely absent in the HOS secondary market. These findings generally concur with the interpretation of Wong, Deng, and Cheung (2024), who suggest a binding capital constraint is at work, in particular because it offers a plausible reason for why variables such as the interest rate and domestic credit fail to explain trends in HOS prices.
One of the most significant policies affecting the HOS sector in recent years is the WSM Scheme implemented since 2013, allowing a certain number of additional participants into the HOS secondary market every year. Our analysis shows that this scheme is useful in giving these new participants a chance to buy subsidised HOS flats in the secondary market, with transactions rising substantially in the quarter that they are allowed to enter the market. However, we do not find any significant effect on HOS prices. An interesting finding is that the volatilities of private and secondary HOS prices are basically the same before the WSM Scheme was implemented in 2013, but after its inception, volatility in HOS secondary market prices had since become significantly higher. While Banks et al. (2017) find that higher house price volatility induces households to buy earlier, in the case of the secondary HOS market, it may make it more difficult for HOS homeowners to move to the private housing market. Whether this higher volatility in HOS housing prices has in turn made capital-constrained households buy HOS flats earlier, in the process pushing HOS prices to rise faster than other market segments, is an intriguing topic that deserves further research.
The study of the HOS market is an important topic because it stands at the beginning of homeownership for many households. However, there are some limitations that challenge researchers on this topic. With all time series studies, a dataset with a long time span is vital because it affects the degrees of freedom available, and with the HOS Index, we are only able to start from 2006. For this reason, some variables with a more peripheral influence on housing prices are left out of the study. For example, it is well known that the housing market has links with the stock market (Lee 2017; Fung and Cheng 2021), but it is not included here because the data span is too short. The same case applies to measures of housing market sentiment (Hui and Wang 2014; Wang and Hui 2017), which can have a variable influence on house prices and transactions.
The other challenge is the difficulty of quantifying or otherwise lacking disclosure of some conditions for HOS transactions. As discussed in this paper, eligibility to participate in the HOS market is subject to income and asset thresholds, which do not always change in lockstep with trends of economic growth, average personal income, or housing prices. Quantifying such information can be a difficulty. Also, the Housing Authority only discloses whether or not the seller of an HOS flat has repaid the subsidy to the government, but not the time when it was repaid. Since there is some flexibility in the time when HOS owners can choose to sell their flats after repaying the subsidy to the government, having this information may improve the study of the HOS market.
Manuscript received on 10 April 2024. Accepted on 30 May 2024.
References
ALLEN, Judith. 2006. “Welfare Regimes, Welfare Systems and Housing in Southern Europe.” European Journal of Housing Policy 6(3): 251-77.
ALLEN, Judith, James BARLOW, Jesus LEAL, Thomas MALOUTAS, and Liliana PADOVANI. 2004. Housing and Welfare in Southern Europe. Hoboken: Wiley-Blackwell.
BALL, Michael. 2006. Markets and Institutions in Real Estate and Construction. Hoboken: Wiley-Blackwell.
____. 2020. “Classifying Housing Regimes. Is it Worth Doing? What are the Alternatives?” Critical Housing Analysis 7(1): 36-48.
BANKS, James, Richard BLUNDELL, Zoe OLDFIELD, and James P. SMITH. 2017. “House Price Volatility and the Housing Ladder.” In David A. WISE (ed.), Insights in the Economics of Aging. Chicago: University of Chicago Press. 87-119.
CAUDEVILLA, Oriol. 2017. “A Comparison of the System of Public Housing in Hong Kong with the System of Public Housing in Spain.” GSTF Journal of Law and Social Sciences (JLSS) 6(1): 23-34.
CHEUNG, Ka Shing, and Siu Kei WONG. 2020. “Entry and Exit Affordability of Shared Equity Homeownership: An International Comparison.” International Journal of Housing Markets and Analysis 13(5): 737-52.
CHEUNG, Ka Shing, Siu Kei WONG, and Chung Yim YIU. 2023. “Endowment Effects of Shared Ownership: Evidence from Hong Kong.” Housing, Theory and Society 41(3): 271-91.
CHEUNG, Ka Shing, Siu Kei WONG, Kwong Wing CHAU, and Chung Yim YIU. 2021. “The Misallocation Problem of Subsidized Housing: A Lesson from Hong Kong.” Sustainability 13(4). https://doi.org/10.3390/su13041855
ESPING-ANDERSEN, Gosta. 1990. The Three Worlds of Welfare Capitalism. Cambridge: Polity Press.
FORREST, Ray, and Ngai Ming YIP. 2015. “Tenant Purchase, Assisted Home Ownership and Social and Residential Mobility.” Research report 2015.A1.026.15D for Central Policy Unit, Hong Kong SAR Government.
FUNG, Michael King-fai, and Arnold Cheuk-sang CHENG. 2021. “The Wealth Effects of Housing and Stock Markets on Consumption: Evidence across Nations Including China and Hong Kong.” In Michael King-fai FUNG, and Bruno S. SERGI (eds.), 2021. Modeling Economic Growth in Contemporary Hong Kong. Bingley: Emerald Publishing.
HO, Lok Sang, and Gary Wai-Chung WONG. 2006. “Privatization of Public Housing: Did it Cause the 1998 Recession in Hong Kong?” Contemporary Economic Policy 24(2): 262-73.
——. 2008. “Nexus between Housing and the Macro Economy: the Hong Kong Case.” Pacific Economic Review 13(2): 223-39.
——. 2009. “The First Step on the Housing Ladder: A Natural Experiment in Hong Kong.” Journal of Housing Economics 18: 59-67.
HUI, Eddie Chi-man, and Ziyou WANG. 2014. “Market Sentiment in Private Housing Market.” Habitat International 44: 375-85.
JONES, Margaret. 2003. “Tuberculosis, Housing and the Colonial State: Hong Kong, 1900-1950.” Modern Asian Studies 37(3): 653-82.
KEMENY, Jim, and Stuart LOWE. 1998. “Schools of Comparative Housing Research: From Convergence to Divergence.” Housing Studies 13(2): 161-76.
KHOLODILIN, Konstantin Arkadievich, Sebastian KOHL, and Florian MÜLLER. 2022. “The Rise and Fall of Social Housing? Housing Decommodification in Long-run Comparison.” Journal of Social Policy. https://doi.org/10.1017/S0047279422000770
KOHL, Sebastian. 2017. Homeownership, Renting and Society: Historical and Comparative Perspectives. London: Routledge.
LEE, Koon Nam Henry. 2017. “Residential Property Price-stock Price Nexus in Hong Kong: New Evidence from ARDL Bounds Test.” International Journal of Housing Markets and Analysis 10(2): 204-20.
LEUNG, Charles Ka Yui, Cho You Joe NG, and Edward TANG. 2020. “Why is the Hong Kong Housing Market Unaffordable? Some Stylized Facts and Estimations.” Globalization Institute Working Papers 380. https://doi.org/10.24149/gwp380
LEUNG, Frank, Kevin CHOW, and Gaofeng HAN. 2008. “Long-term and Short-term Determinants of Property Prices in Hong Kong.” Hong Kong Monetary Authority Working Paper 15/2008. https://www.hkma.gov.hk/media/eng/publication-and-research/research/working-papers/HKMAWP08_15_full.pdf
LI, Jing. 2014. “‘I Am Not Leaving Home’: Post-80s’ Housing Attitudes and Aspirations in Hong Kong.” SSRN Working Paper No. 2347914. https://www.cityu.edu.hk/cityuoncities/upload/file/original/705520140620145010.pdf
——. 2016. “Housing Policies in Hong Kong, China and the People’s Republic of China.” Asian Development Bank Institute Paper Series No. 566. https://www.adb.org/sites/default/files/publication/183031/adbi-wp566.pdf
LI, Si-ming, Huimin DU, and Shuang WU. 2022. “Residential Mobility in Hong Kong 1991-2016: Demographics, Policies and Housing Market Dynamics.” Population, Space and Place 28(4). https://doi.org/10.1002/psp.2556
LUI, Hon-Kwong, and Wing SUEN. 2011. “The Effects of Public Housing on Internal Mobility in Hong Kong.” Journal of Housing Economics 20(1): 15-29.
MA, Yiu Chung, Eddie Chi Leung CHEUNG, and Roger Ki Chiu LO. 2024. “A Subsidised Housing Price Indicator for Hong Kong.” Economic and Political Studies. https://doi.org/10.1080/20954816.2024.2356271ORTALO-MAGNÉ, François, and Sven RADY. 2006. “Housing Market Dynamics: On the Contribution of Income Shocks and Credit Constraints.” Review of Economic Studies 73: 459-85.
PRYOR, Edward George. 1972. “A Historical Review of Housing Conditions in Hong Kong.” Journal of the Hong Kong Branch of the Royal Asiatic Society 12: 89-129.
SCHWARTZ, Herman, and Leonard SEABROOKE. 2008. “Varieties of Residential Capitalism in the International Political Economy: Old Welfare States and the New Politics of Housing.” Comparative European Politics 6: 237-61.
SINAI, Todd, and Nicholas S. SOULELES. 2005. “Owner-Occupied Housing as a Hedge against Rent Risk.” The Quarterly Journal of Economics 120(2): 763-89.
WANG, Ziyou, and Eddie Chi-man HUI. 2017. “Fundamentals and Market Sentiment in Housing Market.” Housing, Theory and Society 34(1): 57-78.
WONG, Siu Kei, Ka Shing CHEUNG, Kuang Kuang DENG, and Kwong Wing CHAU. 2021. “Policy Responses to an Overheated Housing Market: Credit Tightening versus Transaction Taxes.” Journal of Asian Economics 75. https://doi.org/10.1016/j.asieco.2021.101330
WONG, Siu Kei, Kuang Kuang DENG, and Ka Shing CHEUNG. 2024. “Starter Home Premium and Housing Affordability.” The Journal of Real Estate Finance and Economics68(1): 52-73.
YEH, Anthony Gar On. 1990. “Unfair Housing Subsidy and Public Housing in Hong Kong.” Environment and Planning C: Politics and Space 8(4): 439-54.
[1] HOS involves the government building new HOS housing estates, sometimes with the participation of private developers; the first sale was held in February 1978. For a detailed chronology of assisted homeownership and an account of the development of housing policy in Hong Kong, see Forrest and Yip (2015). A full list of all HOS estates, time of sale, number of flats, size of flats, and sale prices is provided by the Housing Authority, Hong Kong SAR government.
[2] As explained in the Legislative Council Panel on Housing (2012), from 1978 to 1982, HOS flats were sold at cost. After that, prices were set at a discount against the prevailing market price. In recent years, the pricing mechanism also takes into account the general income level of target buyers. See Legislative Council Panel on Housing, HKSAR Government, 2012, “Initial Ideas on Price Setting and for Calculating the Premium Payable under the New Home Ownership Scheme,” https://www.housingauthority.gov.hk/en/common/pdf/about-us/housing-authority/ha-paper-library/SHC06-12-EN.pdf (accessed on 8 June 2024). For an explanation of current policy on the pricing of HOS housing and eligibility criteria, see the website of the Housing Authority at https://www.housingauthority.gov.hk/en/about-us/policy-focus/policies-on-public-housing/index.html (accessed on 6 June 2024).
[3] The high demand for social housing in Hong Kong is not just an artifact of post-World War II underdevelopment. According to the Housing Authority, in the year 2023, 13,700 PRH flats were allocated to applicants, but the mean waiting time for a flat still became longer at 5.8 years. In addition, in October 2023, around 9,600 HOS flats were offered for sale to eligible applicants in the primary market and attracted more than 172,000 applications. See https://www.info.gov.hk/gia/general/202310/05/P2023100500383.htm?fontSize=1 (accessed on 6 June 2024).
[4] Authors’ calculation. Data from the Hong Kong Annual Digest of Statistics 2023 published by the Census and Statistics Department, Hong Kong SAR government. HOS housing is not the only subsidised sale scheme in Hong Kong. Over the years, many other schemes with varying criteria for selecting buyers were launched, but they were generally small in scale. Taking these schemes together, the same publication reveals that in 2023, 15.6% of households in Hong Kong resided in subsidised sale housing, and an additional 30.7% in PRH.
[5] The Housing Authority has various initiatives dedicated to improving the quality of its social housing, through better building design for newly built estates and enhancing management standards of its existing estates. See https://www.housingauthority.gov.hk/en/business-partnerships/quality-housing/index.html (accessed on 6 June 2024). Also, the private sector is invited to participate in building some public housing from time to time.
[6] The HKMU Home Ownership Scheme Price index is developed and maintained by the authors, and its method is discussed at length in Ma, Cheung, and Lo (forthcoming).
[7] In the past, only households who were within the income and asset limits of PRH could apply to buy HOS flats in the secondary market. Since 2013, the WSM Scheme was implemented, allowing households whose incomes were higher but still within HOS income limits (called white form buyers) to buy HOS flats also.
[8] Si-ming Li, 2015, “Land and Housing Policies in Post-handover Hong Kong: Political Economy and Urban Space,” Public Policy Research Funding Scheme Final Report No. 2013.A2.001.13A; Si-ming Li and Huimin Du, 2021, “Complex Housing Tenure and Residential Relocation: The Case of the Hong Kong Special Administrative Region,” Public Policy Research Funding Scheme Final Report No. 2019.A2.039.19D.
[9] The problem with land supply has always been, and continues to be, a problem for Hong Kong. For a recent large-scale government-led consultation, see Task Force on Land Supply, 2018, “How to tackle land shortage?” Development Bureau, HKSAR Government, https://www.devb.gov.hk/filemanager/en/content_1051/Land_Supply_En_Booklet.pdf (accessed on 10 June 2024).
[10] See also Hong Kong Federation of Youth Groups, 2010, “A Study on Economic Dependence on Family among Young People in Hong Kong (II) Housing Problem,” Youth Study Series 45, https://yrc.hkfyg.org.hk/wp-content/uploads/sites/56/2021/10/YS36_Eng.pdf (accessed on 12 June 2024).
[11] Applications to rent PRH flats are subject to income and asset limits that are adjusted from time to time. The income and asset limits vary depending on the size of the household. Since April 2024, a typical 4-person household must have monthly income no higher than HKD 30,950 and net assets no higher than HKD 590,000. The latest criteria are published on the Housing Authority website at https://www.housingauthority.gov.hk/en/flat-application/income-and-asset-limits/index.html (accessed on 13 June 2024). Applicants to buy new HOS flats and WSM buyers in the secondary HOS market are subject to higher income and asset limits. The current limits were announced in 2023. For households with sizes of two people or above, the monthly income must be no higher than HKD 62,000 and assets no higher than HKD 1,470,000. See https://hos.housingauthority.gov.hk/mini-site/wsm2023/en/general-info.html (accessed on 13 June 2024).
[12] Such high price-to-income ratios for private properties is the main reason why Hong Kong is described by some studies as the city with the most expensive real estate in the world. However, a common problem, as highlighted in Leung, Ng, and Tang (2020), with such international comparisons is that the large proportion of households who live in subsidised or government provided housing is not considered. In Hong Kong, only the wealthier families participate in the higher-end private property market. The affordability indices using only private property prices are therefore likely to be inflated.
[13] See for example Housing Authority, 1996, “Report on the Review of Home Ownership Schemes,” https://www.cityu.edu.hk/cityuoncities/upload/content/original/705520220314065258.pdf (accessed on 11 June 2024), and Forrest and Yip (2015), who document the same aims from government documents from 1977. Even recently, these aims are regularly reiterated in various forms on official occasions, such as various editions of the annual reports of the Housing Authority.
[14] Hong Kong Housing Authority, 2019, “Annual Report of 2018/19: Enhancement of the Housing Ladder, Betterment of Living Quality,” https://www.housingauthority.gov.hk/mini-site/haar1819/en/dlpdf.html (accessed on 11 June 2024).
[15] See footnote 11 for the most up to date income and asset thresholds of different types of social housing.
[16] To deter speculation in HOS housing and to keep subsidies within the subset of eligible households, after initial sale of new HOS flats in the primary market, resale by the initial buyers can only be to the Housing Authority at a lower price than the initial level within a set number of years, typically five. This period is extended to ten years for newly-built HOS flats since 2022. For each HOS estate, this period is decided by the government and may be different.
[17] Domestic credit is measured by loans and advances for use in Hong Kong. Data obtained from the Hong Kong Monetary Authority (HKMA).
[18] Participants of the WSM Scheme are chosen through a balloting process. Once chosen, they will receive the Certificate of Eligibility to Purchase from the Housing Authority. This certificate allows participants to purchase an HOS flat in the secondary market within the next 12 months.
[19] We are aware that the CEP is valid for 12 months, so potentially the effect of a cohort of WSM buyers can last for four quarters. However, media reports indicate that this effect is uneven across the year, with the bulk of purchases concentrated in the first months immediately after the buyers receive their CEPs. We have tried to include more lags in the WSM dummy, but they are not significant in all our estimations, highlighting that its effect on the HOS secondary market is frontloaded.
[20] Hong Kong Housing Authority, 2019, “Annual Report of 2018/19: (…),” op. cit., p. 17.